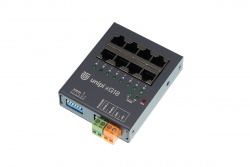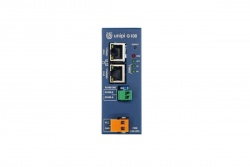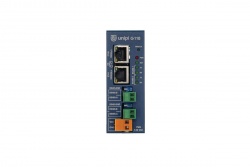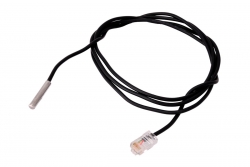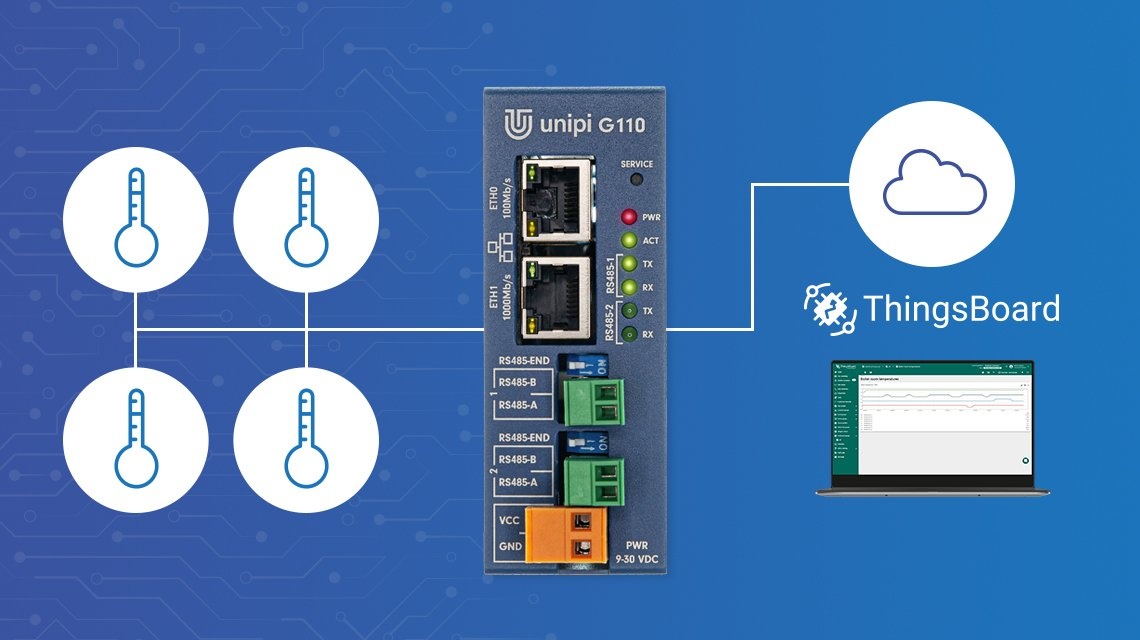
Check out our guide on how to use the Unipi Gate and Extension xG18 to aggregate temperature data and send them to a cloud platform.
Introduction
Unipi Gate is a product line of programmable gateways designed for remote monitoring and management of existing technologies. This article demonstrates how to read temperatures from theí Unipi Extension xG18 8-channel 1-Wire extension module using the Unipi Gate, send the values to the ThingsBoard cloud platform via the Node-RED software and visualize them.
Data loggers are mostly specialized devices with the option to connect an external memory (USB flash disks or SD cards) and to periodically sample and store values from the monitored technology. Analysis of the data often includes copying it into a computer and visualising it in programs such as MS Excel.
The advent of cloud services and IoT paved new methods of aggregating data to a single place and performing more effective, fully automated analyses and visualisations of both historical and real-time data. Devices usually communicate with such services via so-called APIs (application programming interfaces), with data visualisation and analysis performed through a web browser providing instant accessibility from any place in the world.
Currently, there are many cloud platforms (data aggregation services) available. Most large network companies usually offer a similar service, for example, Google Cloud Platform, Microsoft Azure or IBM Watson. Services differ from each other mainly by their target user (i.e. whether the service is intended for application developers or represents an end solution). Another important factor is the service’s price policy - data aggregation is usually provided for free up to a certain capacity, with additional data or devices being subject to various charges and subscriptions.
In this article, we will use the ThingsBoard platform that allows data aggregation and visualisation. The service offers a one-month free trial and does not require a credit card number as opposed to its competition.
HW connection and configuration
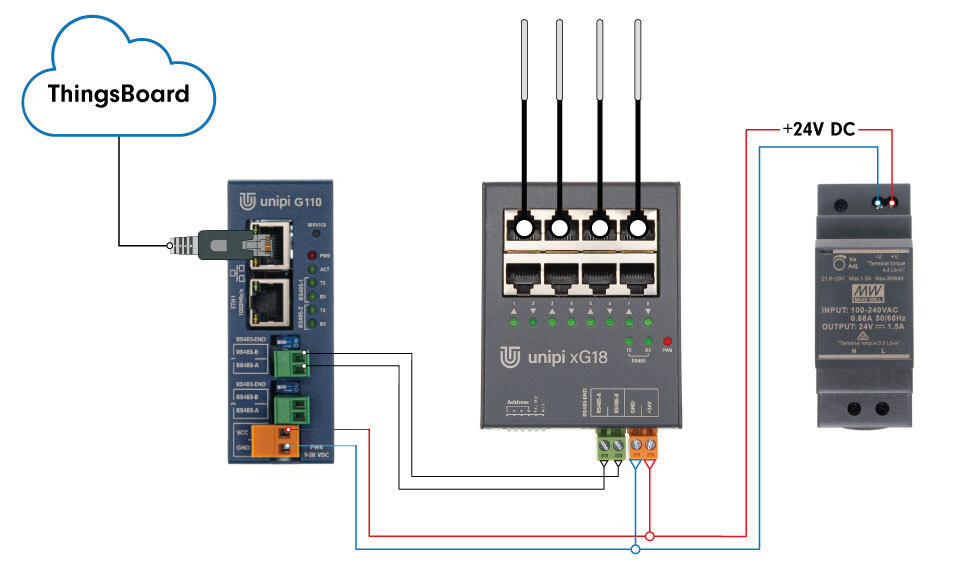
The project uses a 24V DC power source to power the Unipi Gate G110 and Extension xG18. Unipi Extension modules act as Modbus RTU slave devices communicating through the RS485 interface. A regular twisted pair cable will be sufficient for connection to Unipi Gate over short distances. For longer distances, we recommend using a shielded twisted pair cable. We also recommend to ground the shielding on one side of the line and to set up termination resistors on devices at the end of the serial line, using their onboard DIP switches.
Node-RED configuration
The Node-RED platform will be used as the software solution to collect the data from xG18, format them, and send them into the cloud. Node-RED is included in the default operating system that is pre-installed to Unipi Gate controllers during their assembly. Alternatively, it can be downloaded from the Unipi webpage and uploaded into the PLC using the documented method.
The Node-RED will start automatically upon connecting the Unipi Gate to the network and plugging in the power supply. Node-RED’s control panel can be accessed through a web browser on the Unipi Gate’s IP address. The address can be obtained in several ways - using a network scan application or mDNS. The latter uses the device’s name for identification, consisting of a model name and serial number. For Unipi Gate G110 with serial number 130, the name will be g110-sn130. Enter the name into a browser, e.g. http://g110- sn130 (the “http://” must be added as well).
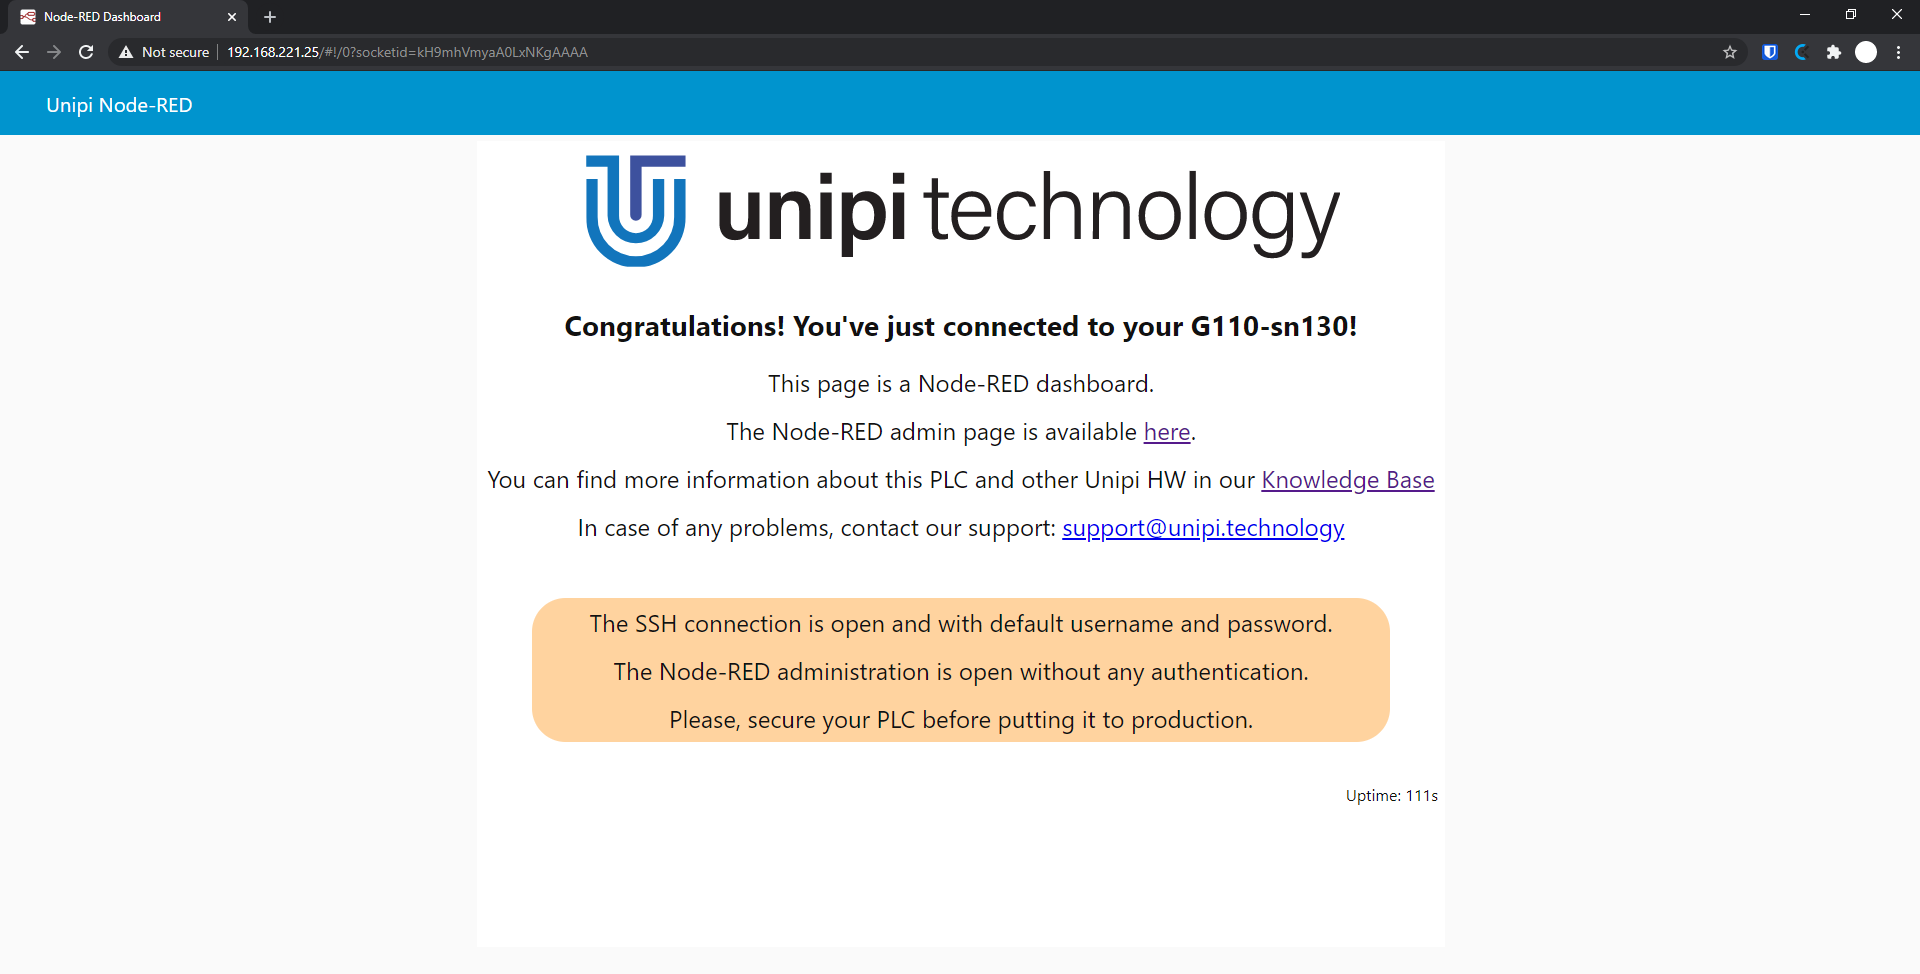
This page is created directly in the Node-RED dashboard. The Node-RED control interface is accessible on port 1880 or through the Node-RED admin page (see the picture above). Upon clicking on it, the default program will appear, which we can leave unchanged.
The first step in building our temperature reading project is to create a new program (flow). Click on the “+” button:

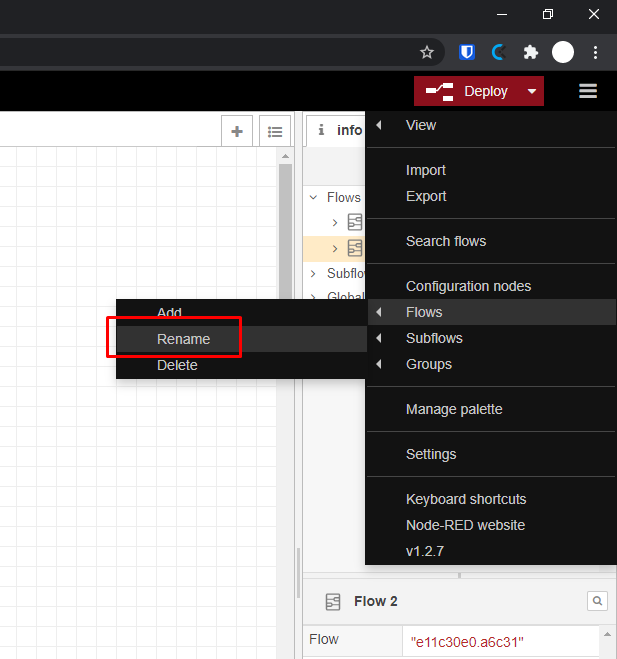
A new flow will be created. We can name it “xG18 to ThingsBoard”, for example, by clicking on the Menu icon and selecting Flow →-> Rename.
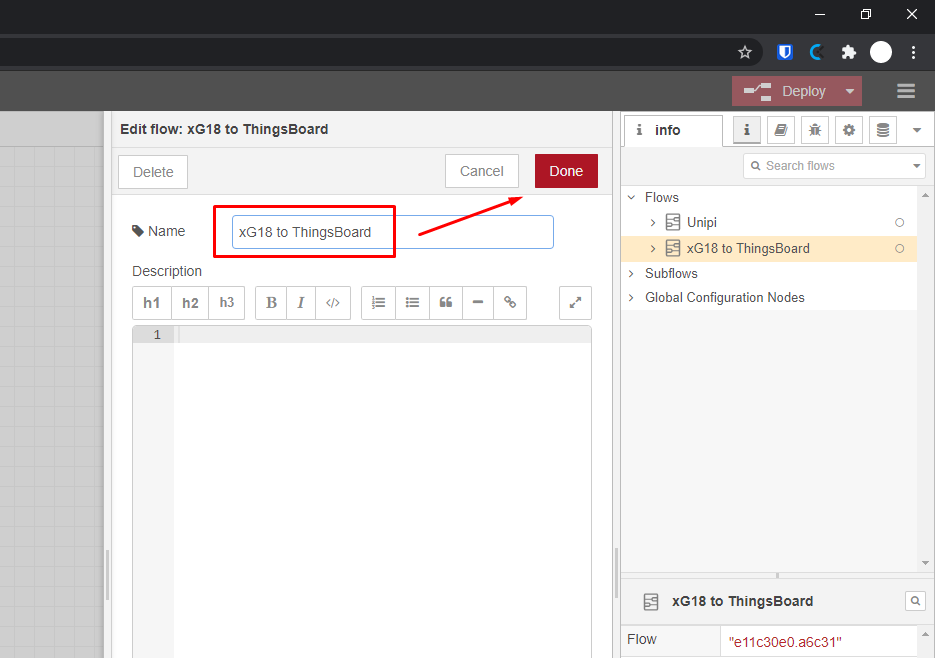
In the dialogue window, rename “Flow 2” to “xG18 to ThingsBoard” and confirm.
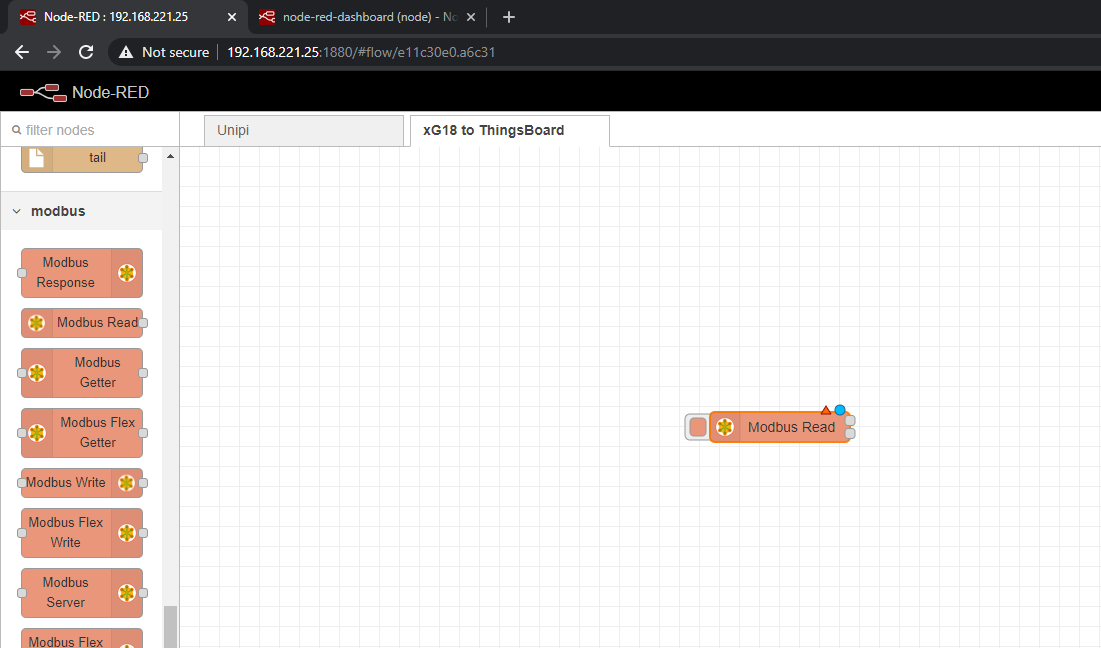
The next step is to set up communication with Unipi xG18. The device communicates via Modbus RTU protocol, and our Node-RED installation already contains all required function blocks (so-called “nodes”). A list of all nodes can be found in the left scrolling menu, including all available blocks for Modbus communication:

We will use the “Modbus Read” node to read the registers. Bear in mind the search dialogue over the list uses only single words and will not return any results to the phrase “Modbus Read”. Hover the cursor over the block, drag it with the mouse and drop it into the empty program:
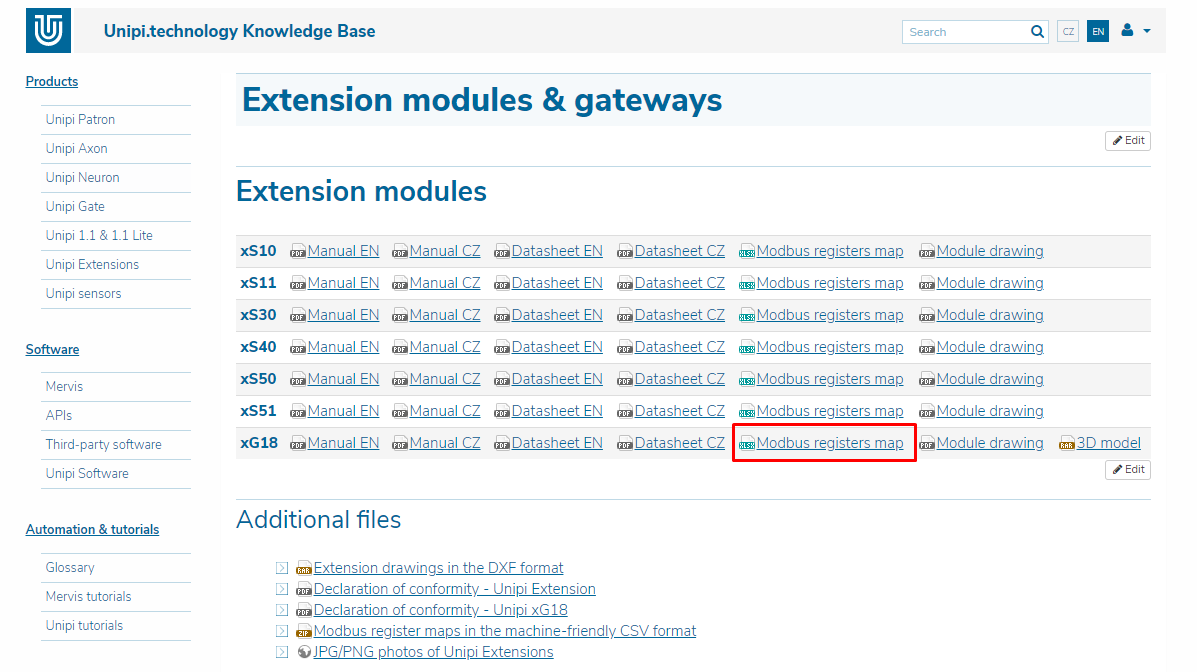
Now, let’s take a look at the Modbus registers map section of the Unipi xG18 documentation. You can find it in the “Downloads” section on our Knowledge Base:
Open the document. The required registers are listed in the “Registers” tab:
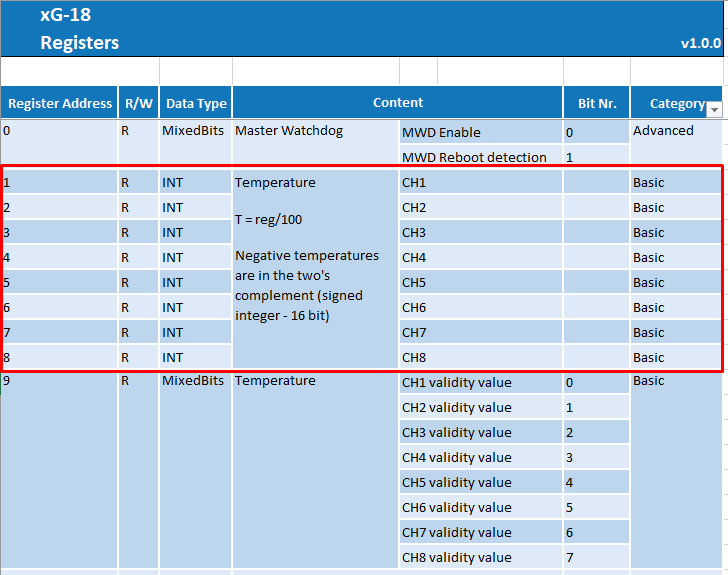
As the documentation tells us, temperature values are available in registers at address 1-8. Each temperature is placed in its own register, its value multiplied by 100 and rounded to integers. This method of transmitting decimal numbers from a certain range and accuracy is typical for Modbus. This means the values collected from the device have to be divided by 100, producing a temperature value accurate to two decimals. Bear in mind the negative values are represented as two's complement.
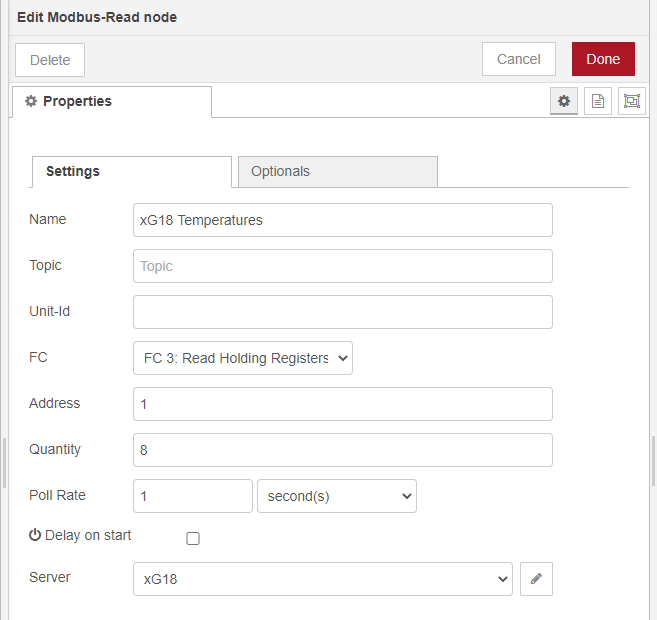
We can now use this knowledge to configure data reading. Double-click on the “Modbus Read” block to display its properties menu and configure the device as follows:
- Name: "xG18 Temperatures"
- FC or Function Code: "FC 3: Read Holding Registers" - reading so-called holding registers that contain temperature values
- Address: 1 - Address of the first register we want to read
- Quantity: 8 - the number of registers we want to read
- Poll Rate: 1s - how often the data should be polled
Furthermore, it is necessary to set up Modbus Server communication parameters. Click on the pencil icon next to the “Server” tab:

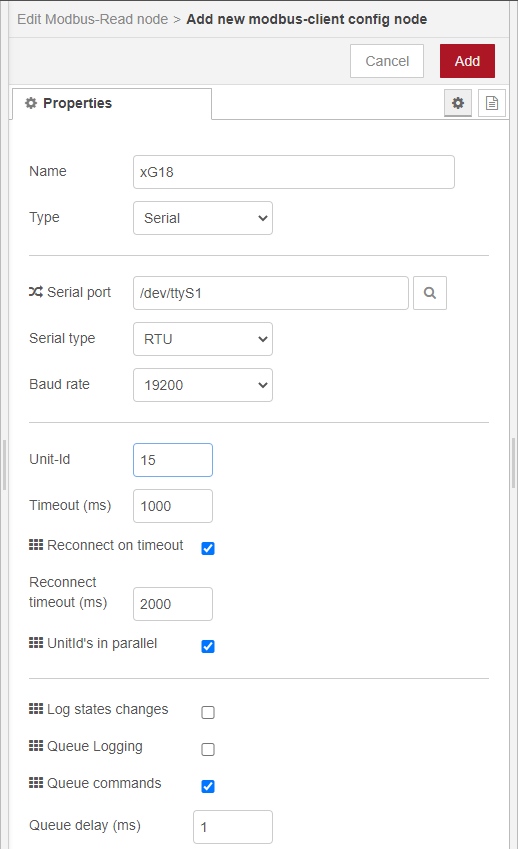
In the default configuration, the xG18 module has its Modbus address set to 15 with 19200 baud, 8 data bits, 1 stop bit, and no parity. More info about communication parameters configuration is available on this link. In the communication parameters configuration window, set up the following attributes:
- Name: xG18
- Type: Serial
- Serial port: /dev/ttyS1
- Serial type: RTU
- Baud rate: 19200
- Unit-Id: 15 - this is the Modbus address of the Unipi xG18
Other parameters (8N1) are left at default values. To change them, you need to change the Type parameter to “Serial Expert”. The resulting configuration should look like this:
Confirm by clicking on the “Add” button and returning to the previous register reading configuration window. The window should look like this:
Confirm the dialogue by clicking on “Done”. The communication is now configured and we can test its functionality. Find the “debug” block in the left list of available blocks and add it into the program next to the block we named “xG18 Temperatures”:
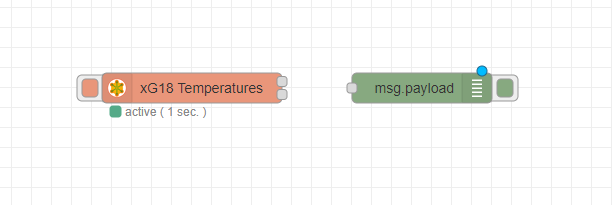
Hover the cursor over one of two points on the block’s right side until the point changes its colour to orange. Click and drag to create a connection line originating from the point:
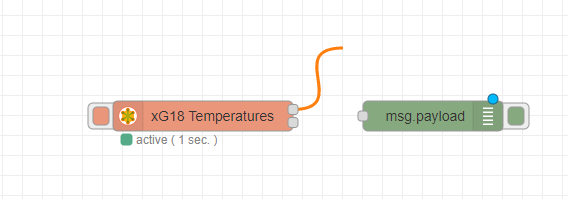
Move your cursor over the input (left) point of the green block, while still holding the mouse button. When the input point turns orange, release the mouse button:

We just configured sending the collected temperature values into a block that will display them in the debug window. It is a useful tool allowing you to connect to various parts of the program and to check which data (and which data format) “flow” in the program.
Unipi Gate does not execute the program yet. All changes must be deployed first by clicking on the “Deploy” button:
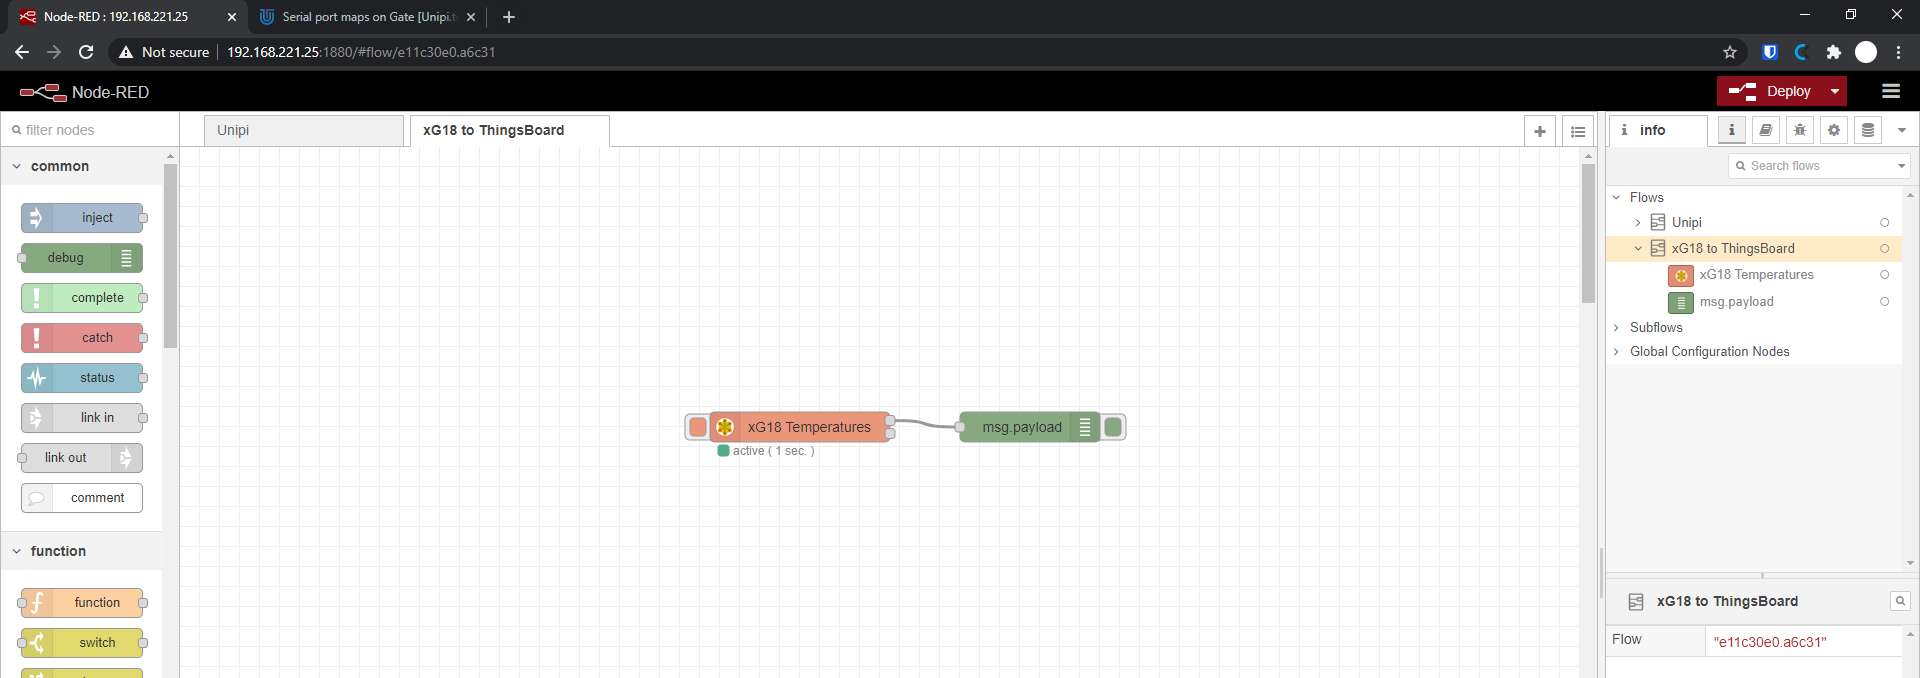
If the button is red, the program contains changes that were not yet deployed. Upon a successful deploy, the button will turn grey. Deploy the program into the device and click on the bug icon placed in the right panel to display a debugging tab that contains data generated by the “debug” function block:
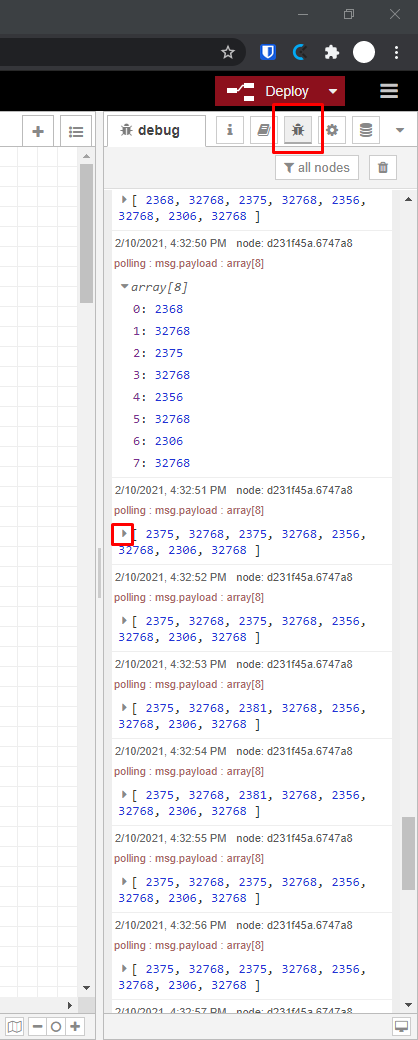
We can see a continuously increasing number of messages generated by the Modbus Read block. If we open any of the messages by clicking the triangle icon, we can see the block contains a Javascript object with an 8-value field. This object is in the standard Node-RED format, i.e. the data is stored in the “payload” parameter.
As we can see, a value of 2375 is at position 0. It is a raw value from register 1 and represents the value sent by the sensor connected into port 1. The 2375 number represents a temperature of 23.75 °C. We now need to convert these values to real temperature values and prepare the data to be sent directly into the ThingsBoard cloud.
Data is sent to ThingsBoard using MQTT and must include a JSON object containing names of the individual data and their value. At the moment, we do not have any names, only a field of values. Let’s name the data as “temperature_1”, “temperature_2”, and so on. As Node-RED does not include a suitable tool for such data transformation, we need to use a Javascript function. In the left panel, we can find one named “function”. Add it into the program in the same way as before.
We also need to insert the function between reading and logging blocks, as we want it to process the data and forward them to the following block. Hover the cursor over the “wire”, click on it when it turns orange, and remove it by pressing “Delete”. Then add a new wire between the reading block and the function, and another one between the function and the logging block. The result should look like this:

Now, we need to configure the function to perform the required data transformation. Double-click on the function’s block to open its properties. Rename it to “Temperature calculation” and change the function’s body to the following code:
var UInt16 = function (value) {

return (value & 0xFFFF);

};


var Int16 = function (value) {

var ref = UInt16(value);

return (ref > 0x7FFF) ? ref - 0x10000 : ref;

};


msgWithNames = {'payload': {}};

msg.payload.forEach(function (item, index, arr) {

    msgWithNames.payload['temperature_'.concat(index+1)] = Int16(item) / 100;

});

return msgWithNames;
The result should look like this:
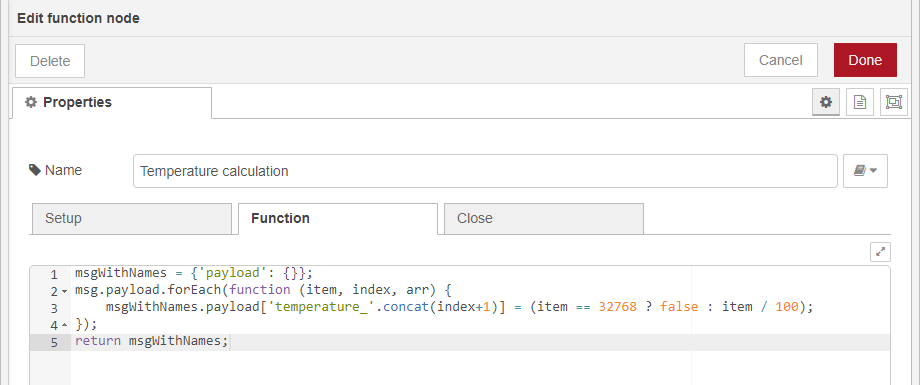
Before deploying the changes, let us explain the function’s operation.
Lines 1-8 contain auxiliary functions for the conversion of a number represented by its two’s complement.
On line 10, we will create a local variable named msgWithNames on line 10 and store an object into it. This object has a “payload” parameter, which is, again, an empty object. By doing so, we can create an “envelope” we can use to store data in the format used by ThingsBoard.
Lines 11-13 contain a cycle that inspects all elements of the msg.payload object field. This object contains data received from the reading block - the same data we previously visualized in the debug console.
Line 12 is a code for data transformation. The right side of the code compares temperature values. If the value is 32768, the sensor is not connected. Using a ternary operator, we will return a “false” for this value. If the value is different (e.g. a correct one), we will divide it by 100. On the left side of the code, we enter the edited and transformed value into a prepared object named msgWithNames.payload.
The last line returns the object containing processed data. The object is then sent to the next block using the output point. Save the changes by clicking “Done” and deploy them into the Unipi Gate using the “Deploy” button. The output format should change in the debug console:
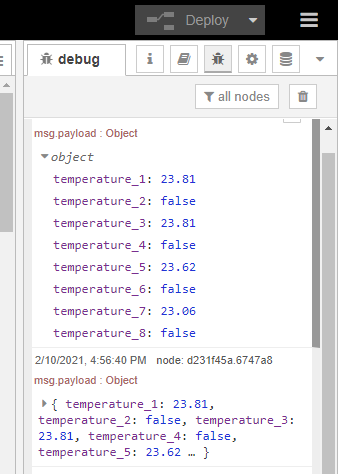
As we can see, we no longer have a field of values after processing function data. Instead, we now have an object containing the “temperature_X” identifier with its value expressed either directly in degrees Celsius, or by a “false” value if the corresponding sensor is not connected. The xG18’s Modbus map also contains a register indicating whether or not the collected value is valid. In this article, we performed only a simple check - the correct course of action would be to compare the data validity against the status register.
We can now proceed to send the data to ThingsBoard.
ThingsBoard configuration
Cloudová platforma ThingsBoard umožňuje sbírat data z různých zařízení, provádět na nich různé operace a akce a taktéž je vizualizovat. V našem ukázkovém příkladu budeme zobrazovat nasbírané teploty.
There are two ways of using ThingsBoard - it is possible to either utilize thingsboard.cloud services or install the entire platform to your infrastructure. This article uses a trial account created on thingsboard.cloud. This account does not require entering credit card info and allows a one-month trial period.
After opening the https://thingsboard.cloud, a login screen will be displayed. We can either log in using an already existing account on various social networks, or we can create an independent account by clicking “Sign Up”:
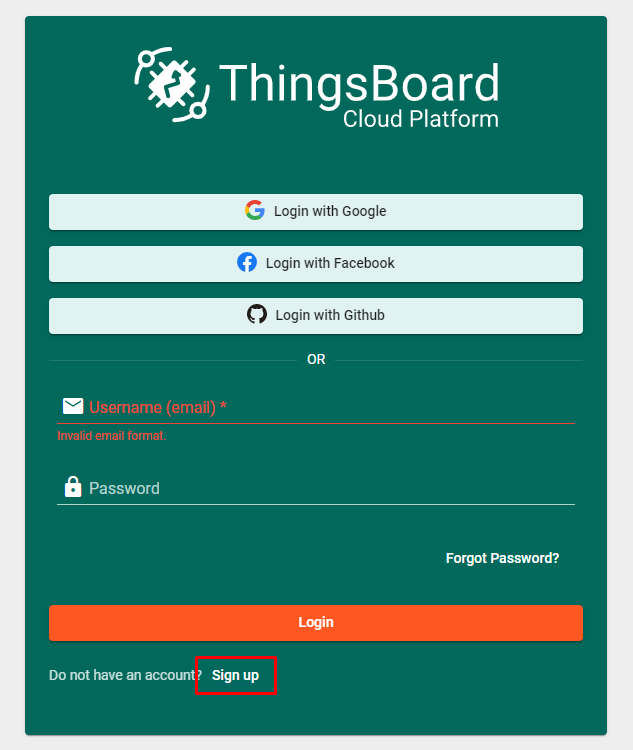
Upon filling in the registration form, a confirmation link is sent to our e-mail. Click on the link and then log in.
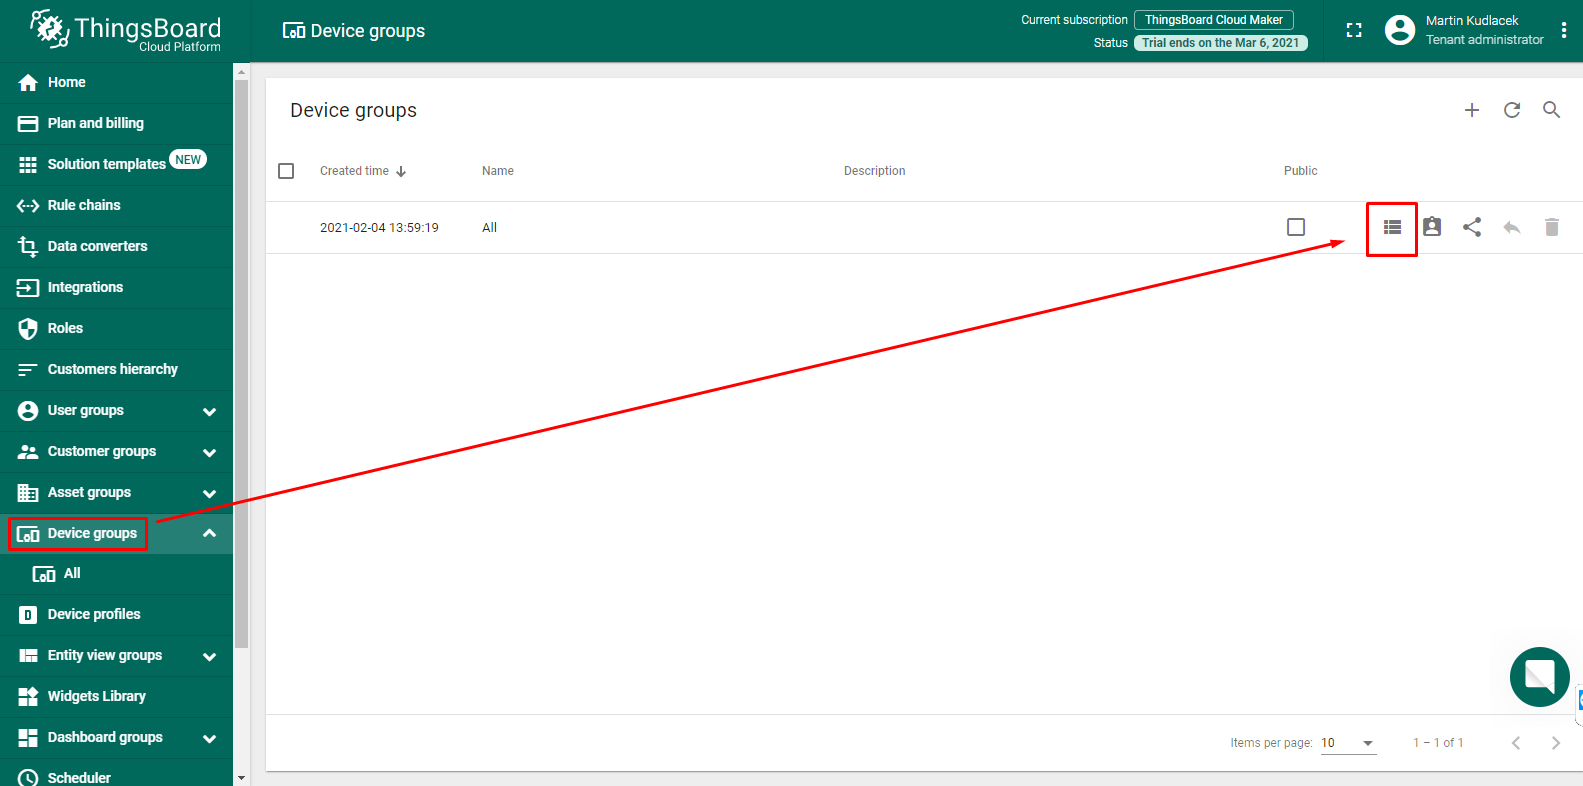
The first step in the admin interface is to create a new device that will send data into the cloud. On the homepage of the interface, click on “Device groups” on the left menu. A list of all device groups will appear. A single group named “All” is available - click on the list icon to switch to a list of all devices of the group:
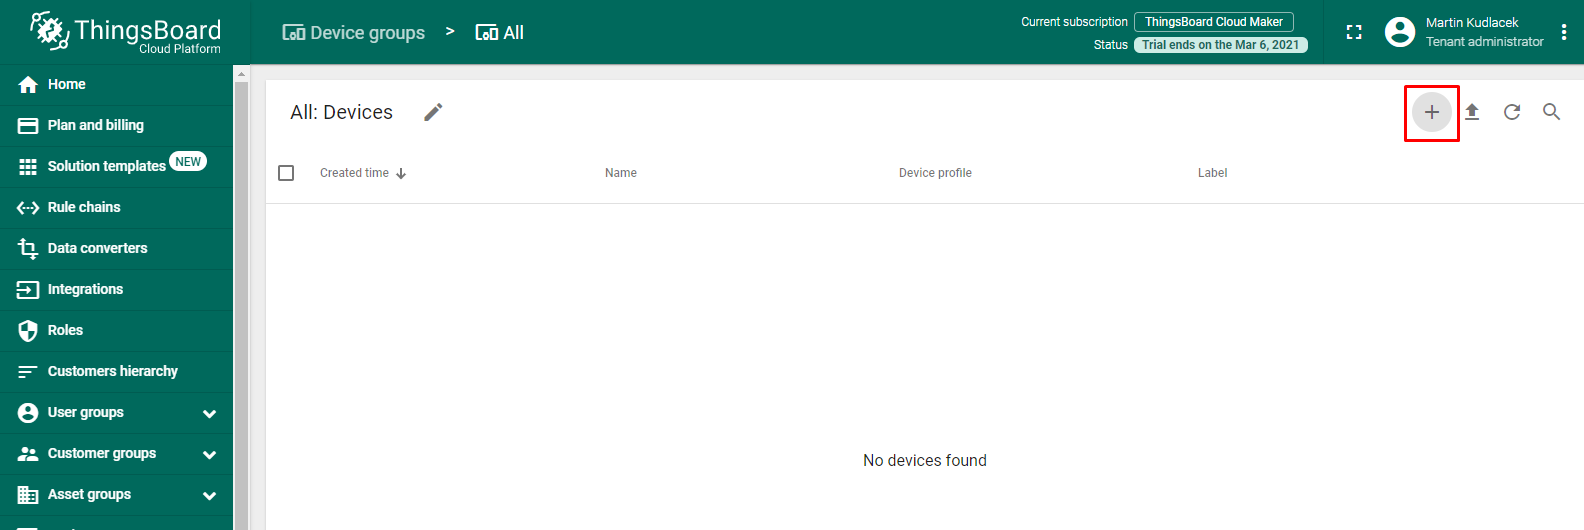
Now add a new device to the group by clicking the “+” button:
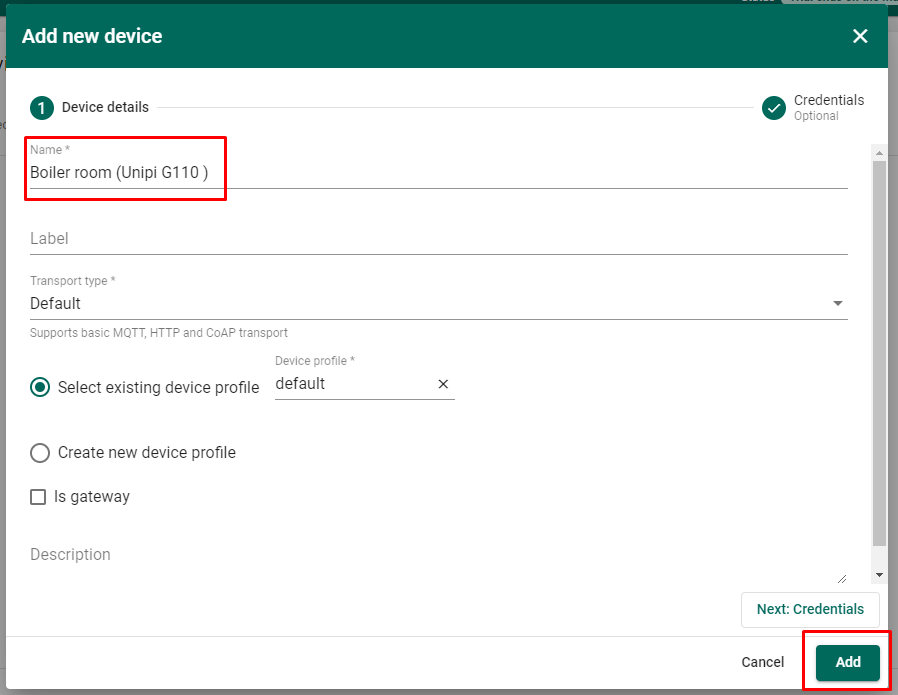
The “Add new device” dialogue will appear. Enter the device’s name to identify it and confirm by clicking the “Add” button:
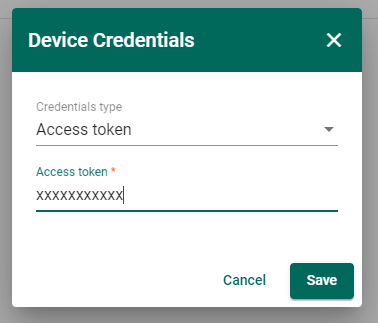
The device is now added to the system. To receive data from it, we need a login and password for it, both of them being unique for each device. Click on the shield icon available in the list:

A dialogue will appear, containing an “Access Token” field. Copy it and close the dialogue:
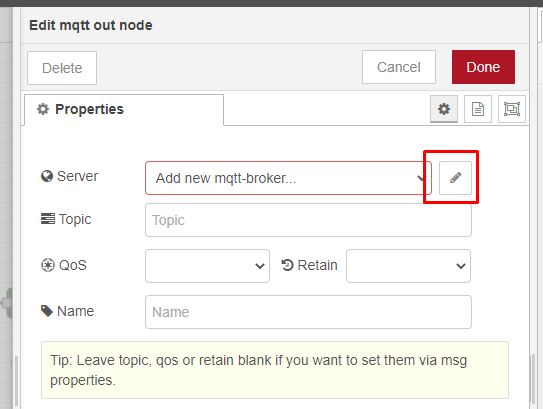
We now need to set up communication with the cloud in the Node-RED interface. The communication uses the MQTT protocol. In the Node-RED’s left panel, find the “mqtt-out” block and add it into the program. Then double-click on it to display its properties. We need to configure the parameters for connection to the MQTT server (broker). Click on the pencil icon:
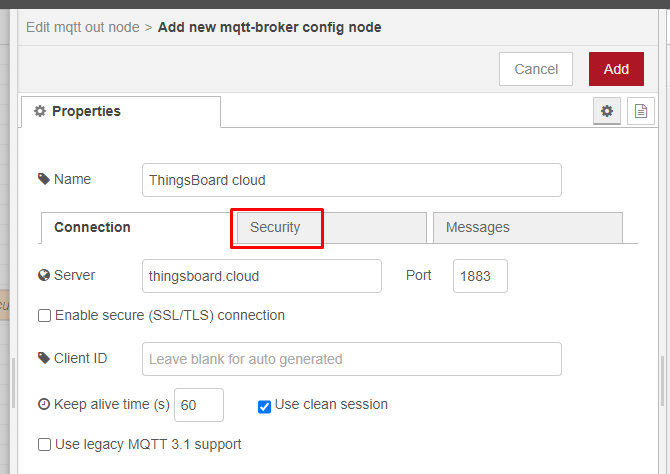
Enter the server’s name (“ThingsBoard cloud”) and address ("thingsboard.cloud") and switch into the “Security” tab:
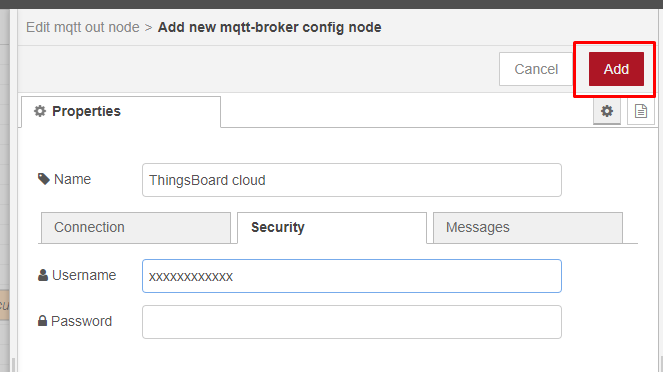
In the “Security” tab, fill out the “Username” parameter by entering the Access token obtained in the ThingsBoard interface. Confirm by clicking on “Add":
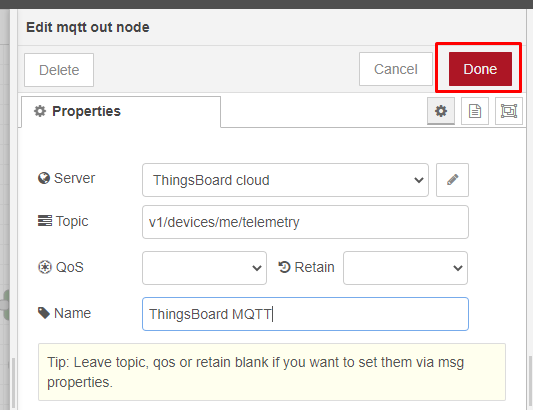
Confirmation of the dialogue returns us to the “mqtt-out” block properties. We have the “Server” item already filled out, so we just need to add a few more parameters:
- Topic: enter "v1/devices/me/telemetry”
- Name: enter "ThingsBoard MQTT"
The resulting dialogue should look like the picture below. Confirm it by clicking on “Done”:
We can now see the renamed block in the program. Connect a wire leading from the “Temperature calculation” block’s output to the renamed block and click on “Deploy”. If everything was done correctly, the MQTT block will display “connected” status:

If the state remains stuck on “connecting” or “disconnected”, please check:
- if you entered the server address correctly
- if you correctly entered the Access token in the “Username” parameter
- if Unipi Gate has access to the internet and the DNS server is functional
With the status “connected”, we can now check if the cloud is receiving any data. In the device list, click on the name of our Unipi Gate:

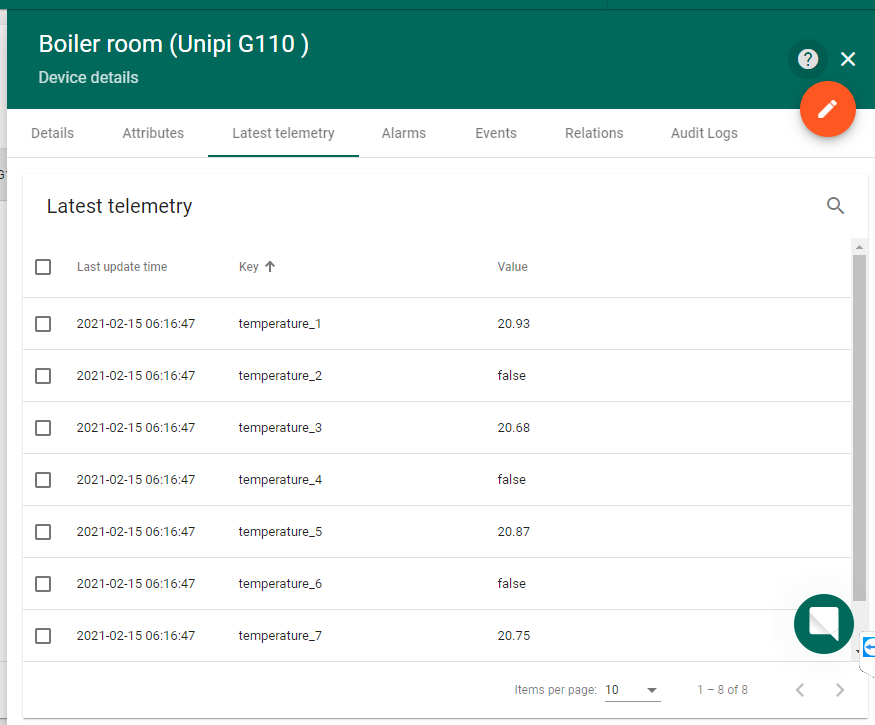
A window with the device’s properties will open. Switch to the “Latest telemetry” tab, which includes the last complete object sent to the cloud. If everything works correctly, the tab should contain the last detected temperature values from connected sensors:
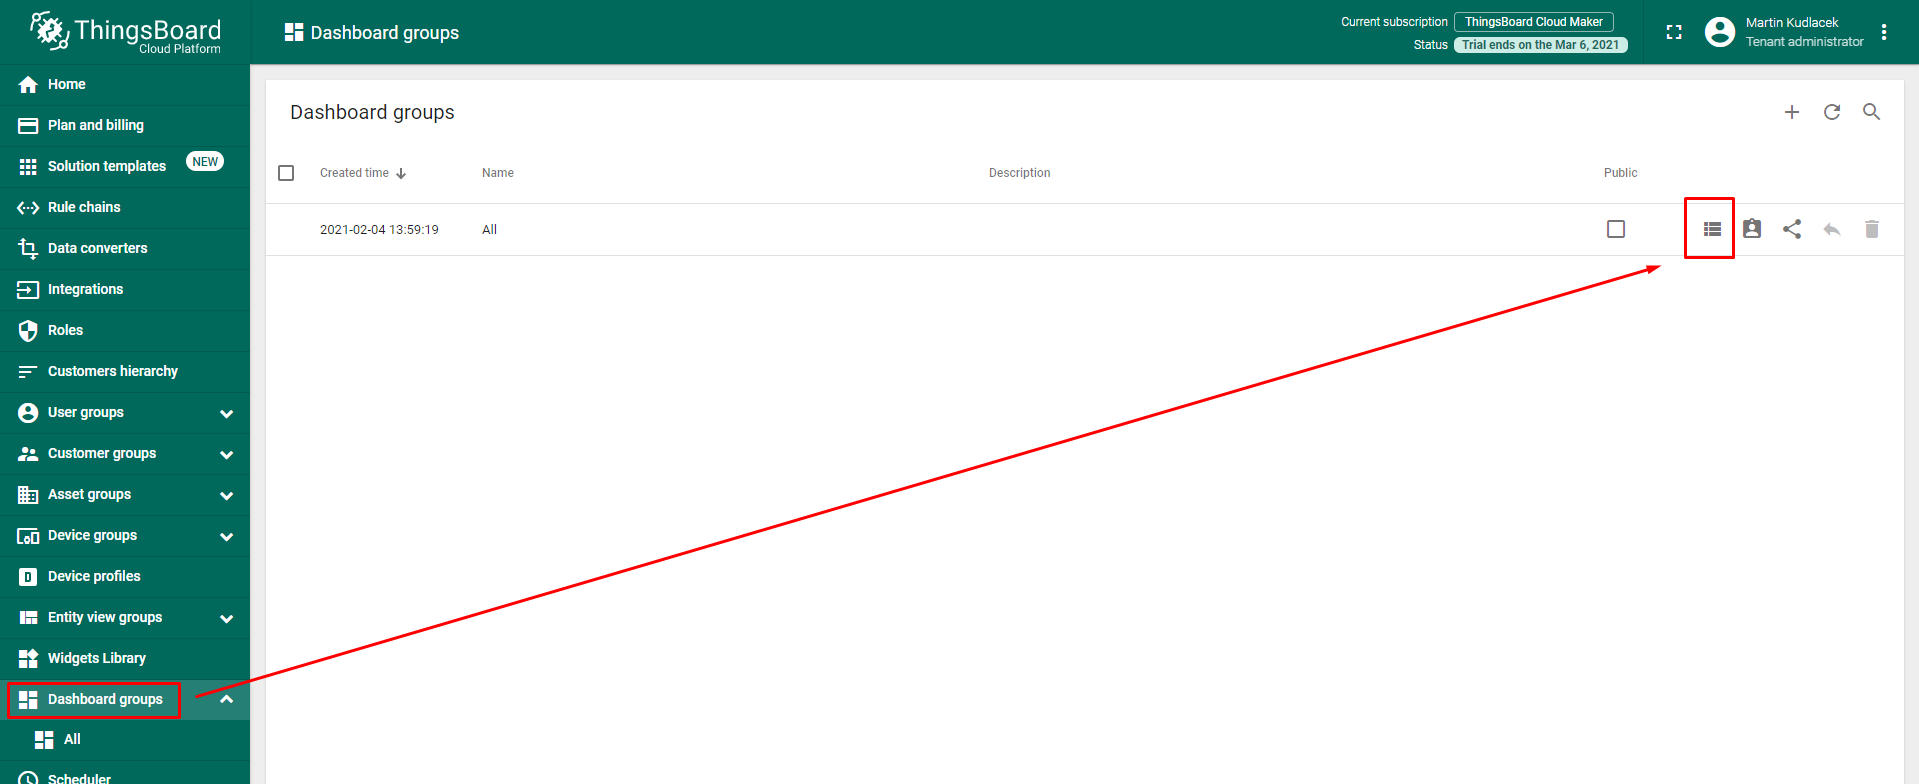
We can now move on to data visualization. Click on “Dashboard groups” on the left menu. The “All” device group is automatically available. Click on the list icon to open it:
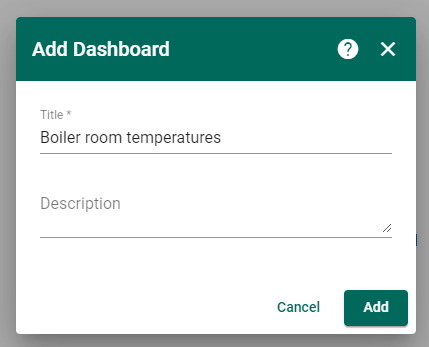
At the moment, there is no dashboard we could add a graphics element into. We can create one by clicking the “+” button:

The “Add Dashboard” dialogue will appear, in which we enter its name: “Boiler room temperatures”. Confirm by clicking on “Add”:
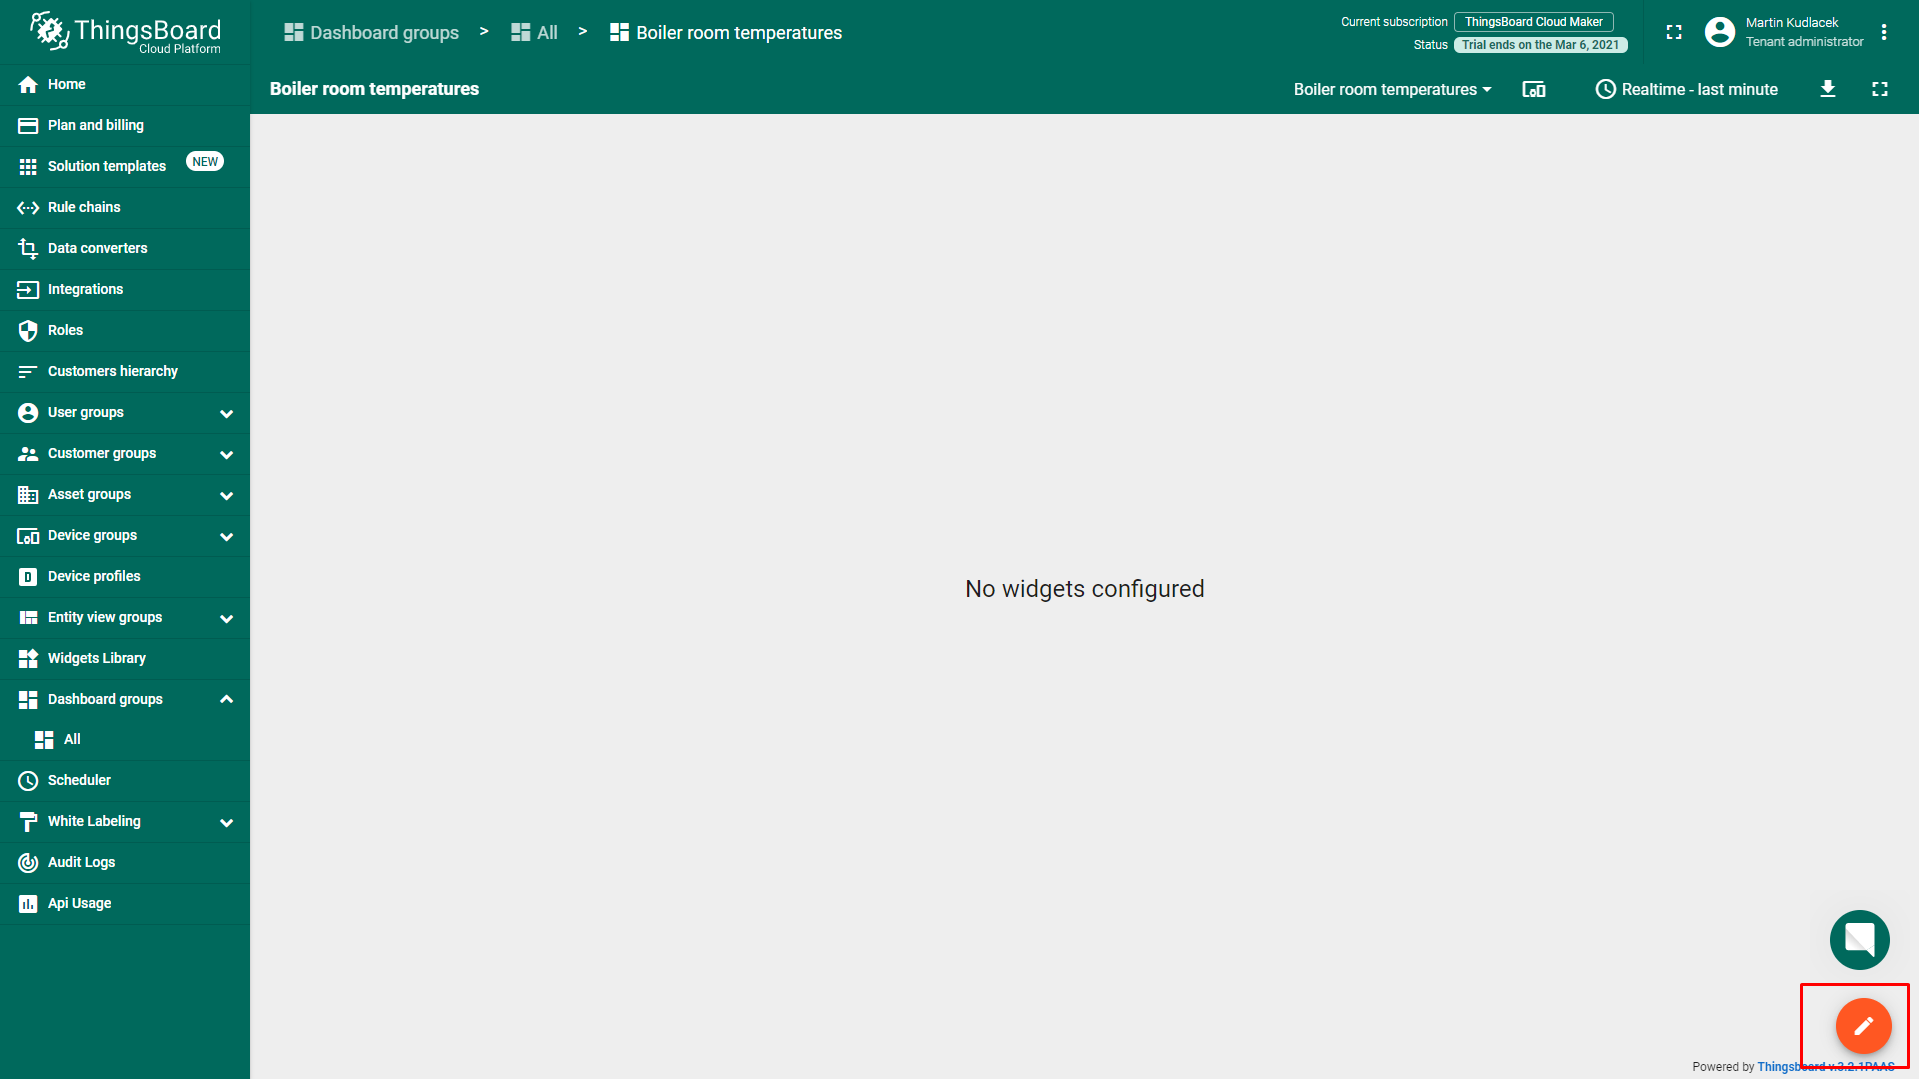
A new dashboard will appear in the list and we can now open it by clicking on its first icon:

The next step is to add graphic elements (widgets) displaying data received from the device. The dashboard must be set to editing mode first by clicking on the pen icon:
Now add a data point. Click on “Entity aliases”:

In the following dialogue, click on “Add alias”:

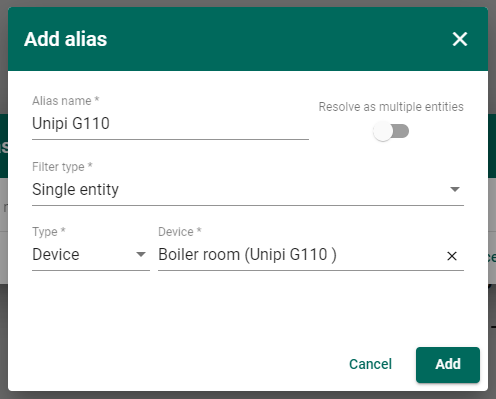
Configure the new alias as follows:
- Alias name: "Unipi G110"
- Filter type: "Single entity"
- Type: "Device"
- Device: the list will display the device we named “Boiler room (Unipi G110)”
The resulting dialogue should look like the picture below. Confirm by clicking on “Add”:
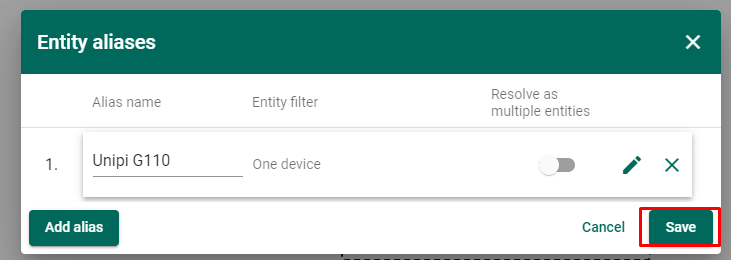
This returns us to the “Entity aliases” list. Save it by clicking on “Save”:
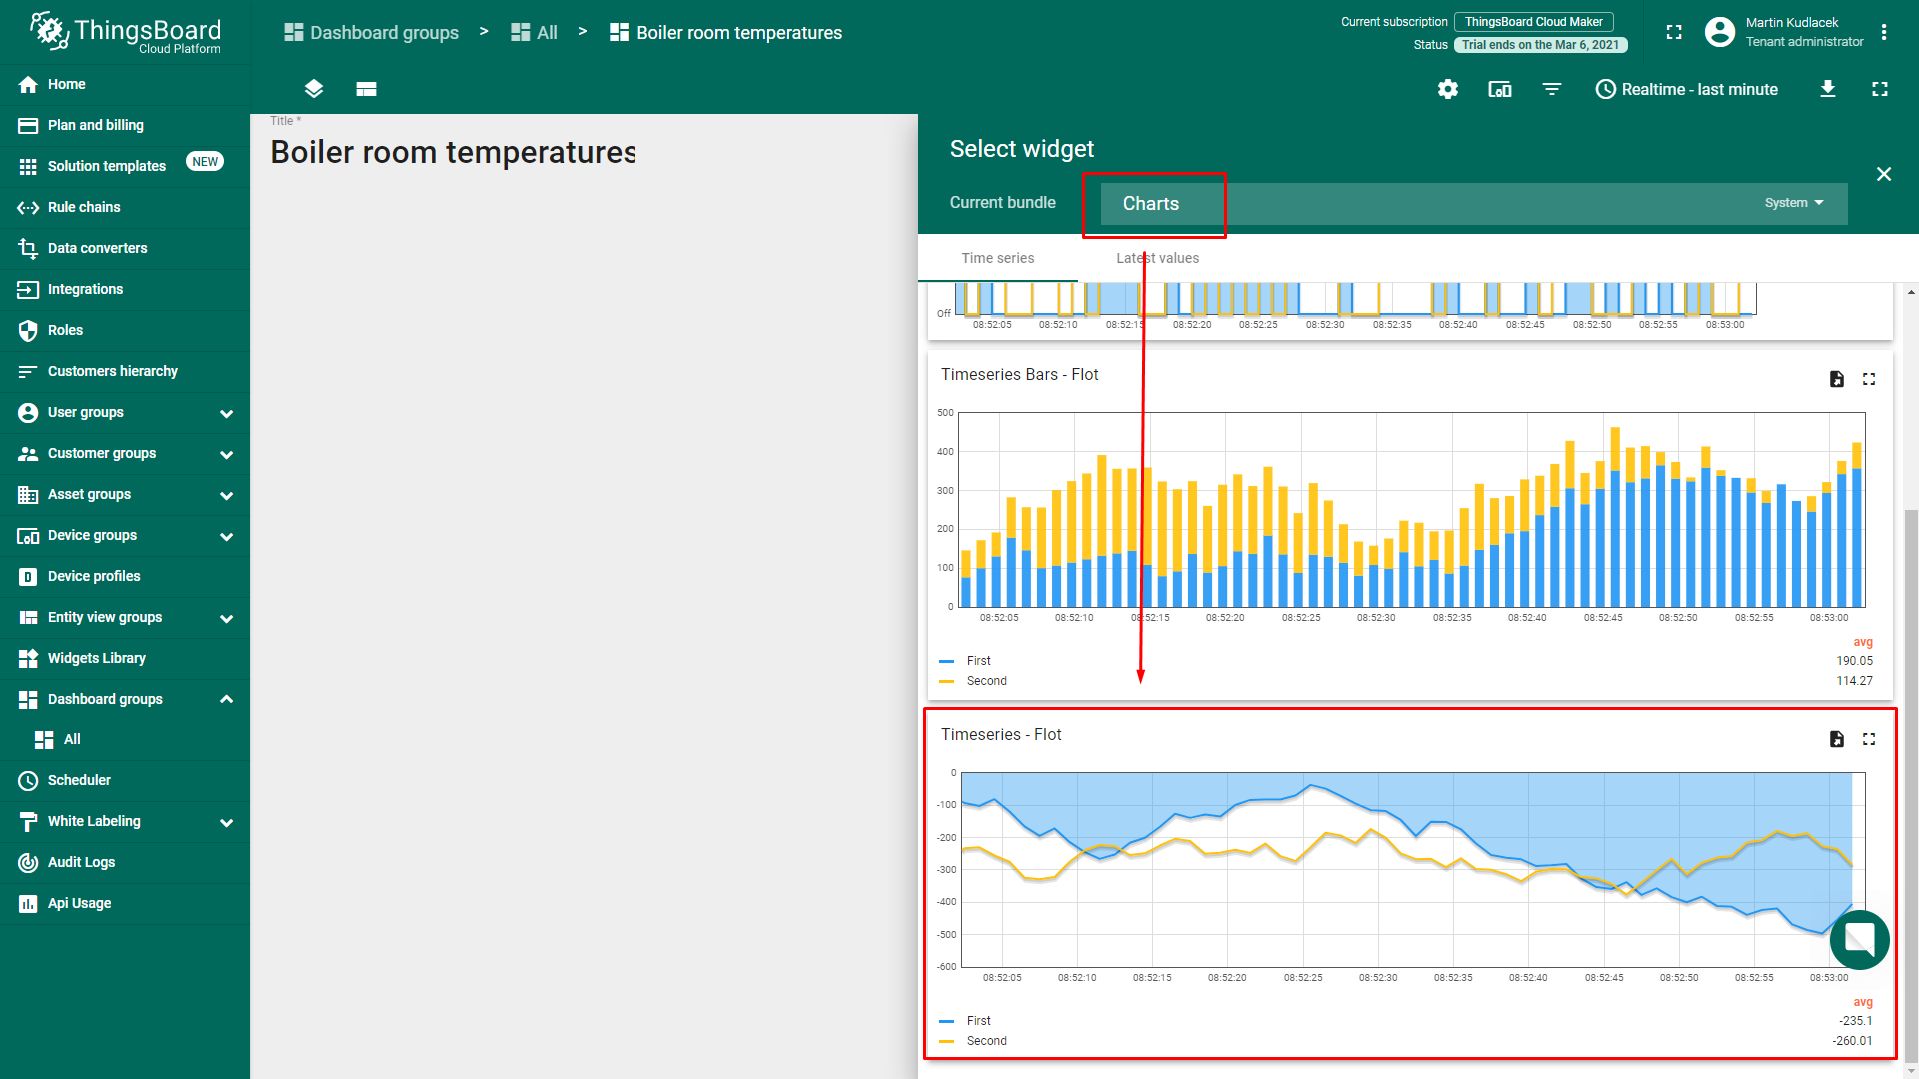
We can now add a graphic element that will visualise all temperatures in a chart. Click on “Add new widget” or on the “+” icon at the bottom of the screen:

In the dialogue “Select widget”, choose the “Charts” widget group, then click on “Timeseries - Flot”:
A dialogue window will open, from which we can choose the source data that will be collected. In the “Datasources” section, click on “+ Add” and select “Unipi G110” in the field “Entity Alias”. The field “Entity timeseries” will automatically load all available values sent from Node-RED:
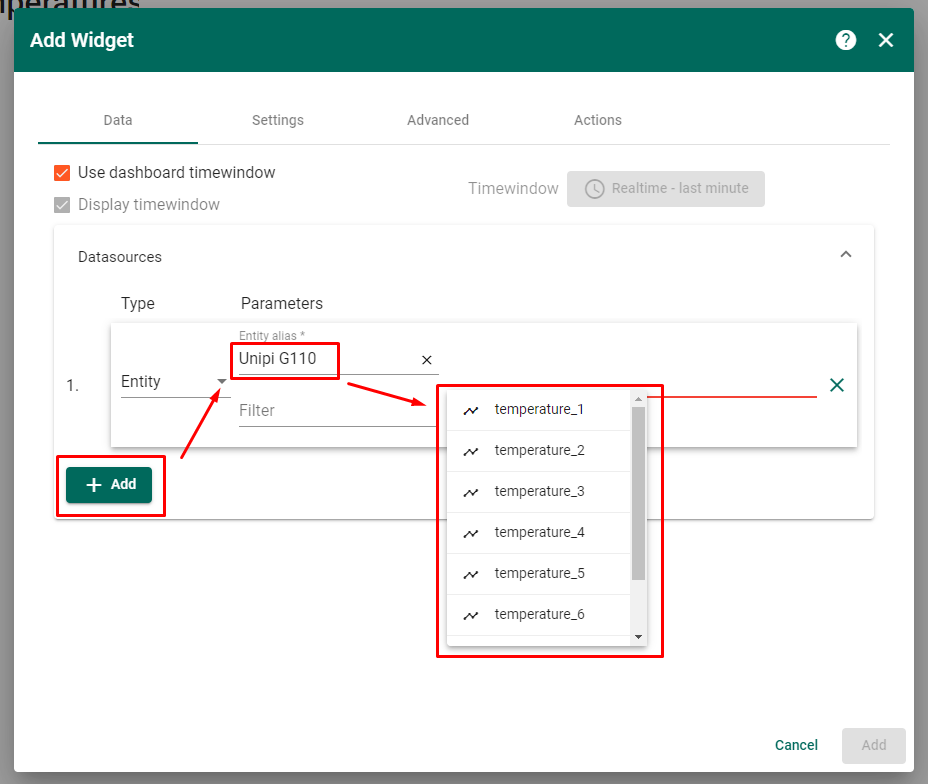
Continue by adding all remaining temperatures, until the dialogue looks like this:
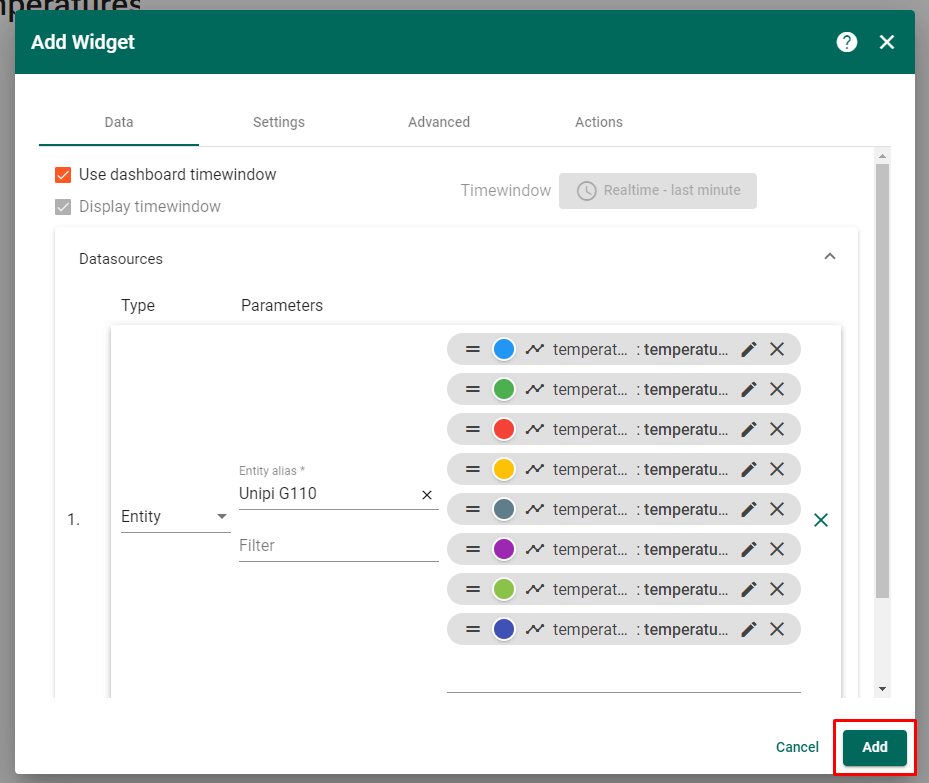
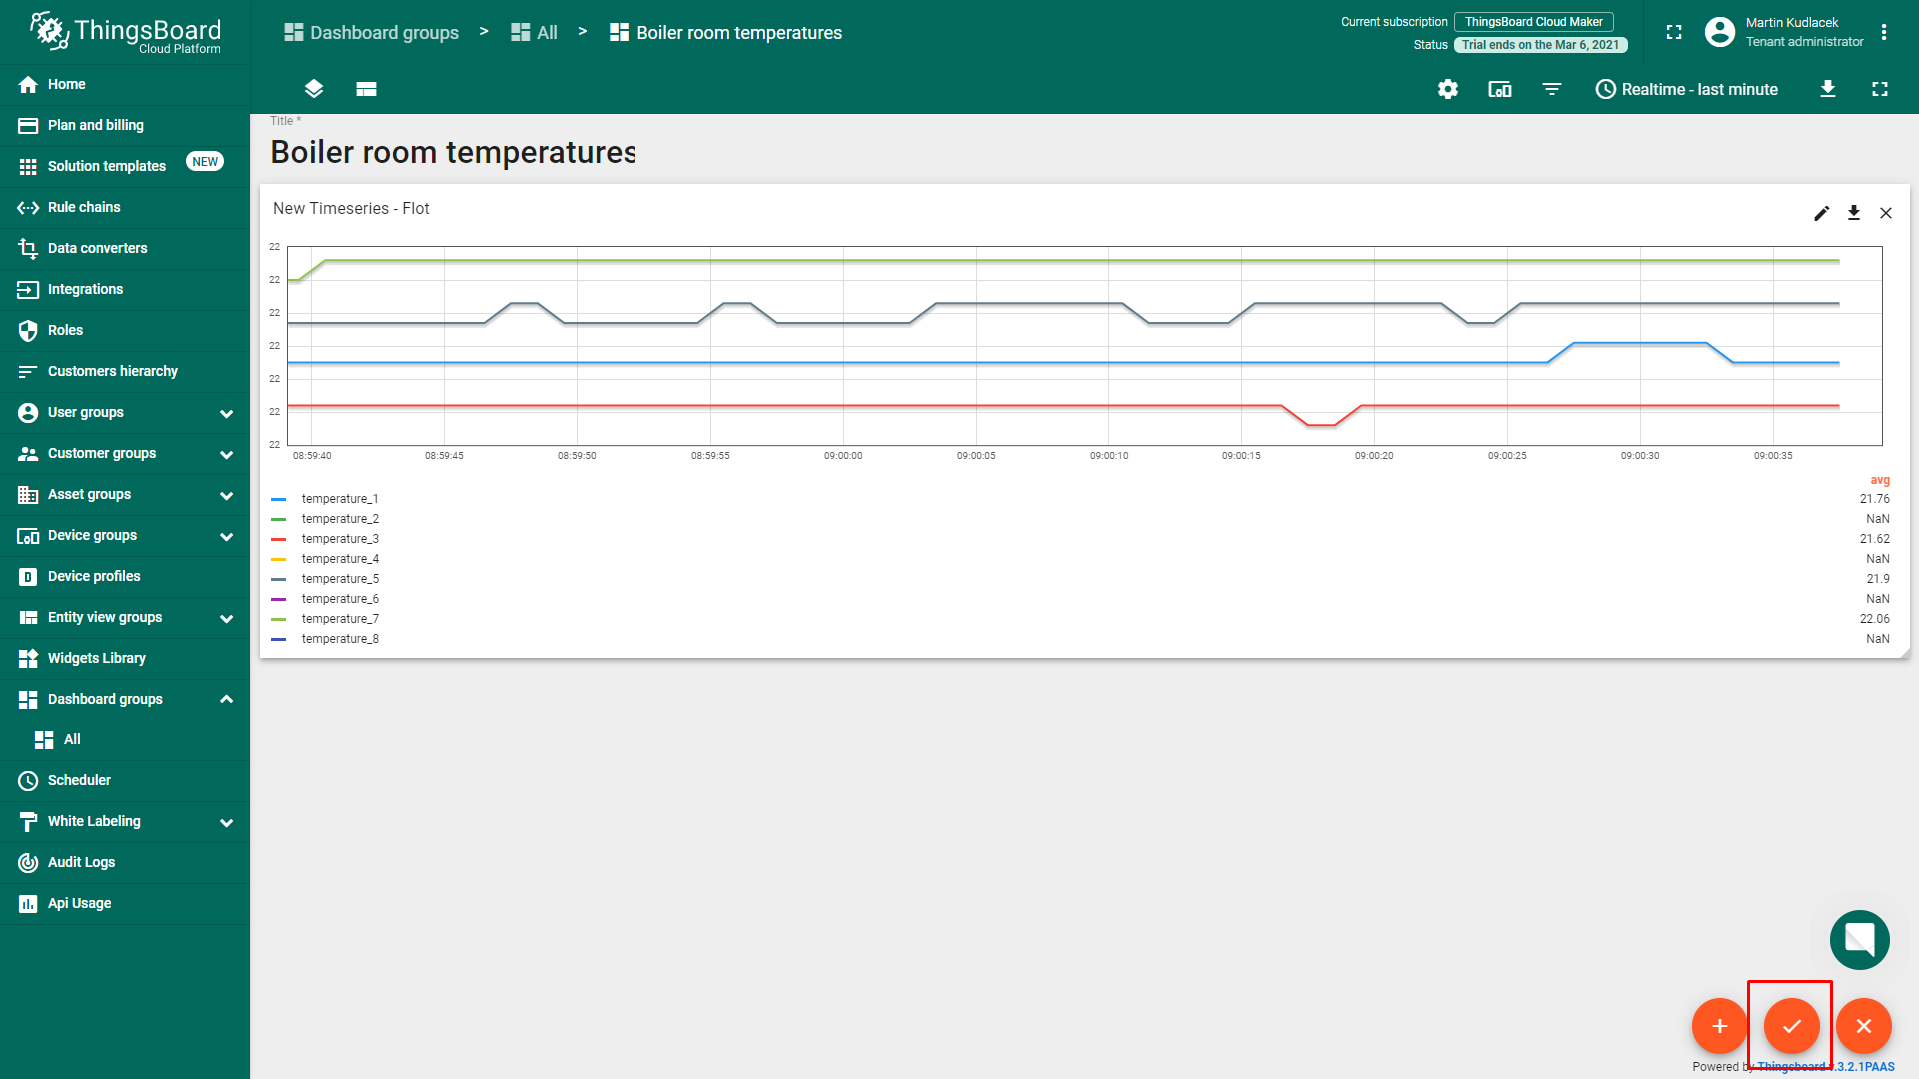
Confirm by clicking on “Add”. The chart will be added to the panel and will display current values at once.
We can expand the chart by clicking and dragging its lower right corner. The refresh period and length of the displayed period can be changed for the entire dashboard by clicking on “Realtime - last minute:”

If the configuration is finished, click on the check mark placed in the bottom right corner:
Conclusion
In this article, we described how to:
- Communicate with a general Modbus device
- Transform data using a custom Javascript function
- Send data via MQTT
- Visualize the data using the ThingsBoard cloud platform
If you were unable to replicate any of the steps, or you have an idea on how to improve the project, feel free to get in touch with us at info@unipi.technology.
