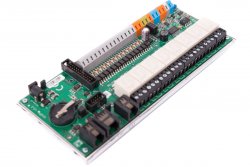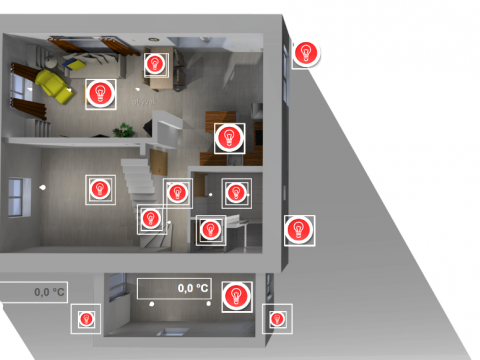
A homemade hydroponics system, controlled by a single UniPi 1.1 control unit via the Cloud4RPi cloud service.
Although the UniPi 1.1 is no longer developed and was superseded by our UniPi Neuron product line, it is still available for purchase and there are still many customers who prefer the 1.1's low cost and simplicity. One of such customers used his UniPi to construct his own homemade hydroponics system, combining the 1.1 with Cloud4RPi cloud service for remote control and monitoring. The Cloud4RPi team was then kind enough to let us publish the project as yet another showcase of UniPi's versatility. We published a similar setup in one of our earlier references here, so this article can serve as a practical example of the solution.
Hardware
As mentioned above, the core of the system is the standard UniPi 1.1 control unit with the following features
- 8 relay outputs
- 1 analogue output
- 2 analogue inputs
- 14 digital inputs
- a single UART port for connecting of serial consoles or a wide range of devices
- a single 1-Wire port for 1-Wire universal bus
- a single L2C bus
The unit is fixed on homemade wooden construction, featuring a single DIN rail and nine electrical sockets. The UniPi is attached to the DIN-rail - on the picture, we can see the unit itself along with a circuit breaker and a terminal block. One of the sockets is serving as a permanent power supply for the UniPi itself, remaining eight are then connected to each of the unit's relay output's, allowing the unit to switch connected devices on/off.
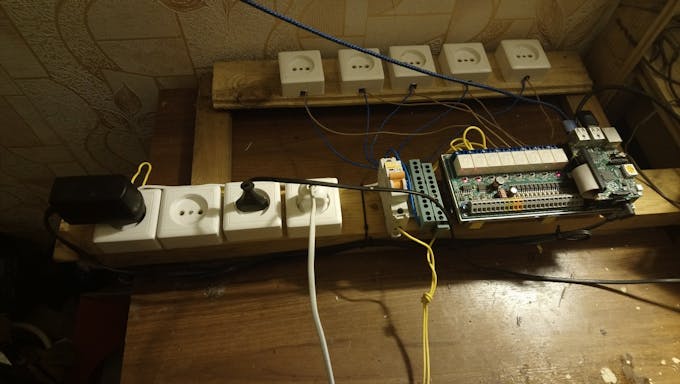
At the moment of taking the photo, the system contained a lightning switch and a watering system, but the user is planning to implement automatic ventilation and constant humidity system in the future.
Software
Thanks to the integration of Cloud4RPi service, the user can monitor his device or collect data from sensors from virtually any place in the world (provided a stable internet connection is available).
The solution is based on the Node-RED - a software made by the IBM company, designed specifically for wiring hardware together and creating algorithms for controlling various IoT devices. It's an easy-to-use tool, which allows to program device behaviour in user-friendly graphical interface. The manual is accessible from our website here. Node-RED needs to be installed on the UniPi.
The second part of the SW solution is the Cloud4RPi service - a cloud control panel, that enables the user to control all devices via Internet and log history. For using this service, the user needs to make a user account on this link.
With the account active, the cloud can communicate with the device in two ways - either through the MQTT message queue, or the via the HTTP web API - a framework for building HTTP services. Both ways could be used, but in this specific example, the MQTT was used for more convenience.
Node-RED + Cloud4RPi connection
In the Node-RED, two types of messages have used
- a device to cloud messages for initial configuration, status reports and gathering of sensor data
- cloud to device messages for issuing commands sent from the control panel
The first step is to send the variables list to the proper MQTT topic - in our case the devices/{token}/config. The message should be sent in JSON format and should look as follows
v{
  "ts": /* Date & Time in ISO 8601 format */,
  "payload": [
    {"name": "Boolean Variable", "type": "bool" },
    {"name": "Numerical Variable", "type": "numeric" },
    {"name": "String Variable", "type": "string" }
  ]
}
devices/{token}/data{
"ts": /* Date & Time in ISO 8601 format */,
payload: {
"Variable Name": "Variable Value",
"One more variable": 42,
/* etc... */
"Yet another variable": false
}
}
The user also has the option to send diagnostic data - these are not logged and are stored in devices/{token}/diagnostics the channel. Diagnostics data look like this:
{
  "ts": /* Date & Time in ISO 8601 format */,
  payload: {
      "Diagnostic Variable": "Variable Value",
      "Another Diagnostic Variable": 12
  }
}
The MQTT connection in Node-RED is done through the flow node, subscribing the topics and sending messages into them.
As to Cloud4RPi configuration, this project uses the servermq.cloud4rpi.io, port 1883 with MQTT 3.1 legacy support disabled.
The node itself is then configured in a way, that specifies channels to communicate with
devices/{token}/config		- variables configuration
devices/{token}/data		- sending variable values
devices/{token}/diagnostics	- sending diagnostic data
devices/{token}/commands	- receiving commands from UI (subscribe to this one)
In the Node-RED's graphical interface, the first step was the inject node with the "Inject once at start" option enabled.


The inject node serves for the triggering of the system startup. Additionally, a timestamp node can be used

This node triggers the sending of variables configuration into the channeldevices/{token}/config, provided the data are shaped initially - for this, the function node is used.
Any JavaScript code can be inserted here, the configuration thus can be returned in the appropriate format.
var message = {
    ts: new Date().toISOString(),
    payload: [
        {"name": "Bool Variable", "type": "bool"},
        {"name": "Number Variable", "type": "number"},
        {"name": "String Variable", "type": "string"}
    ]
};
return {payload: message};
Worth mentioning is the fact, the data package for the mqtt node should be contained in the elementpayload of the associative array sent by the activating node.
Mentioned nodes (timestamp, function and mqtt) were then connected together, forming the following chain:

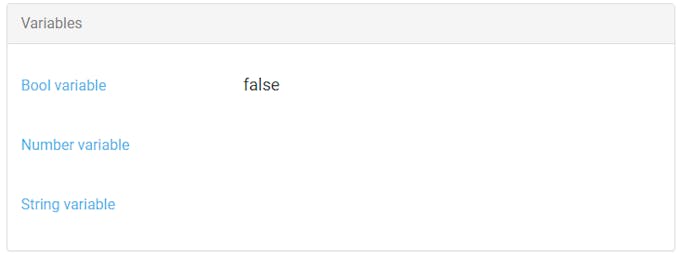
Sending the configuration message results in this notification, displayed on the device page in the Cloud4RPi.
Hardware variables
Hardware-specific variables are configured in the EVOK, our basic control software for UniPi units. Two specific features were used in this project - HTTP (used for sending of the device state request) and WebSocket (for receiving of the device status info).
Variable values are sent in two cases
- on system startup, refreshing the control panel
- when a variable change occurs - in that case, only the changed variable is sent
On system startup, the Cloud4RPi receives the system configuration (and variables) from the same node. Data are however sent with some delay through the added delay node

Request for sending all UniPi variable values is done via the HTTP request sent to the.http://{UniPi IP address}/rest/all An HTTP request node is used for this.

For the data to send in JSON format, the node settings are set as follows

The function node is then used for assembling the received values into the JSON message for Cloud4RPi...
var getMsgValue = function(device, circuit){
  return msg.payload.filter(function(val){
      if(!val.dev){
          return false;
      }
      return val.dev === device && val.circuit === circuit;
  })[0].value;
};
var message = {
    ts: new Date().toISOString(),
    payload: {
        "Relay 1": getMsgValue("relay", "1") === 1,
        "Relay 2": getMsgValue("relay", "2") === 1,
        "Relay 3": getMsgValue("relay", "3") === 1,
        "Relay 4": getMsgValue("relay", "4") === 1,
        "Relay 5": getMsgValue("relay", "5") === 1,
        "Relay 6": getMsgValue("relay", "6") === 1,
        "Relay 7": getMsgValue("relay", "7") === 1,
        "Relay 8": getMsgValue("relay", "8") === 1
    }
};
return {payload: {message}};
...with the following configuration used
var message = {
    ts: new Date().toISOString(),
    payload: [
      {"name": "Relay 1", "type": "bool"},
      {"name": "Relay 2", "type": "bool"},
      {"name": "Relay 3", "type": "bool"},
      {"name": "Relay 4", "type": "bool"},
      {"name": "Relay 5", "type": "bool"},
      {"name": "Relay 6", "type": "bool"},
      {"name": "Relay 7", "type": "bool"},
      {"name": "Relay 8", "type": "bool"}
    ]
};
return {payload: message};
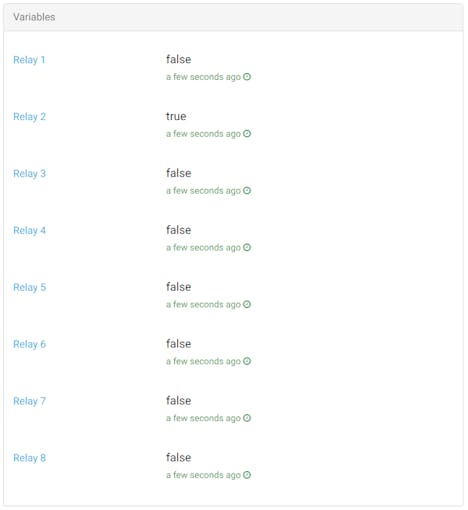
Complete published data then looks as following
For sending the UniPi state change messages, a WebSocket node is used with the addressws://{UniPi IP address}/ws set, using the WebSocket feature of the EVOK.

Messages are sent to the Cloud4RPi in the form of packets - these are created by the function node.
var circuit_number = parseInt(msg.circuit);
var valid_relay = circuit_number >= 1 && circuit_number <= 8;
if (msg.dev === "relay" && valid_relay){
    var relay_name = 'Relay ' + circuit_number;
    return {
        payload: {
            ts: new Date().toISOString(),
            payload: {relay_name: msg.value === 1}
        }
    }
}
The result is this control panel, where individual relays can be switched on/off and the user can instantly see the result in the state display below.
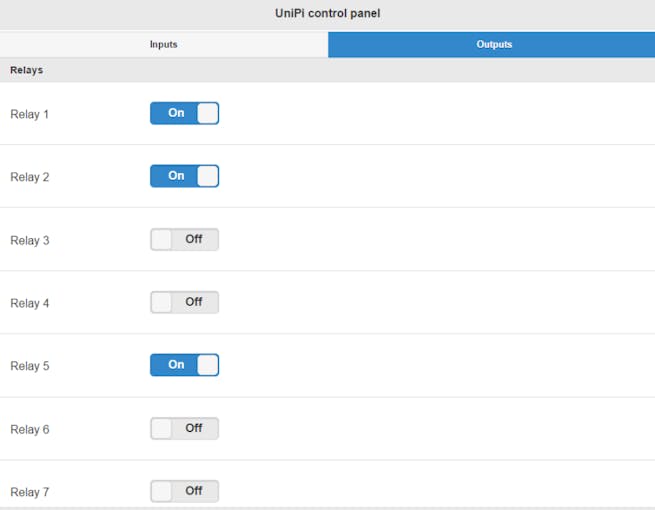
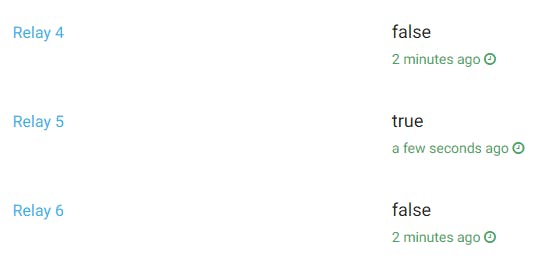
For more convenience, a Switch widget is used on the control panel. This widget is able to display a boolean variable and can send commands to change its state.
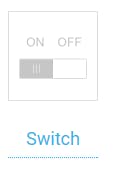
The control implementation in Node-RED is then subscribed into the devices/{token}/commands MQTT channel. The MQTT node, subscribed on the /commands channel is connected to the json node, which transforms MQTT messages into the JSON objects

This node is connected to a function converting the MQTT message into the WebSocket command
for (var var_name in msg.payload){
    if (var_name.indexOf('Relay ') >= 0){
        return {
            cmd: "set",
            dev: "relay",
            circuit: var_name.split(' ')[1],
            value: msg.payload[var_name] ? "1" : "0"
        }
    }
}
Another function node is then connected to the WebSocket node.
Diagnostics
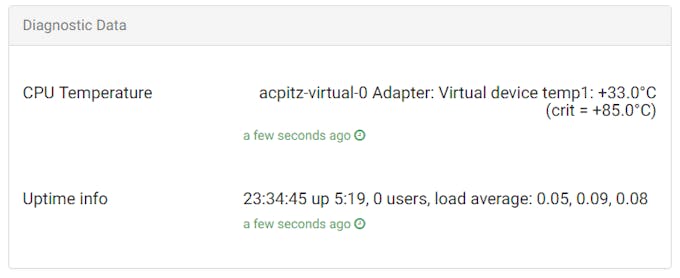
Cloud4RPi features an MQTT channel,devices/{token}/diagnostics used for device diagnostics. In this case, it is used for sending variables reflecting the device state, which then display their values on the Control panel.
In the example provided, the user wants to display the CPU temperature and system update values. For this, the exec node is used in Node-RED.

This node is able to execute an arbitrary bash command and return its result. In the example below, the node is set to send commands every 30 seconds. Two chains are used for value collection - values are then sent to the special Node-Red storage designated flow, which enable to send them into the devices/{token}/diagnosticsMQTT topic later.
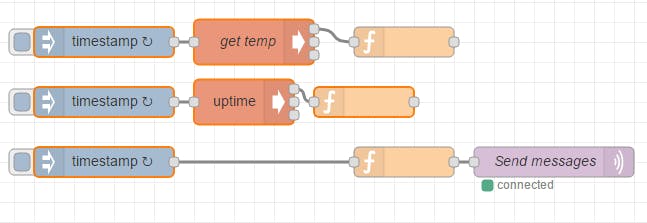
The sending interval is purposedly set to be greater than the request interval, so the requesting node has enough time to collect data before sending them. Values themselves - CPU temperature and the uptime - are acquired by andsensorsuptime commands.
For value storage, function nodes are used, located after exec nodes. These nodes contain these codes
flow.set(‘cpuTemp’, msg.payload) for temperature readings
flow.set(‘uptimeInfo’, msg.payload); for uptime readings.
Messages are then shaped by the following code:
return {
    payload: {
        "ts": new Date().toISOString(),
        payload: {
            "CPU Temperature": flow.get('cpuTemp'),
            "Uptime info": flow.get('uptimeInfo') || ""
        }
    }
}
In the used example, diagnostics data are displayed on the Control Panel approximately 60 seconds after the startup
The original article, containing the used code, can be found here.
